


Intro
This post is part of several posts related to Network Infrastructure Monitoring using the Elastic Stack.
As a starting point lets start with the basics for monitoring events on you network infrastructure -> Logs. There are multiple blogs, articles, books out there that explain the why we need to export the systems logs and correlate them with an external tool, so I will not dwell too much on it and focus more on the implementation aspect.
There is a great article with a Linux target Monitoring Linux Logs with Kibana and Rsyslog – devconnected, that goes end to end -> highly recommend reading it.
Elastic Stack Overview
The Elastic Stack is the name of a family of products that forms a monitoring and/or search solution. It was originally known as ELK Stack (Elasticsearch, Logstash, Kibana) but since the conception of Beats it has changed to Elastic Stack.
For this demo we will be using:
- Logstash: Parse log information from Cisco IOS and Arista EOS routers.
- Elasticsearch: Store log event data.
- Kibana: Visualize the log event data.
Logstash
Logstash is an open source data collection engine with real-time pipelining capabilities. Logstash can dynamically unify data from disparate sources and normalise the data into destinations of your choice.
The Logstash service generally works by configuring a pipeline which is listening on an specific port and protocol for incoming data (this is called the input stage), it then applies an optional filter stage which can be used to parse, mutate, clean or perform more actions on the data, and then is pushed to an external system (using the output stage). You can see here for a full view of the config file structure -> Structure of a Config File | Logstash Reference 7.5 | Elastic
This is referred as a pipeline and its configuration is usually stored inside the config/ directory created with the Logstash installation.
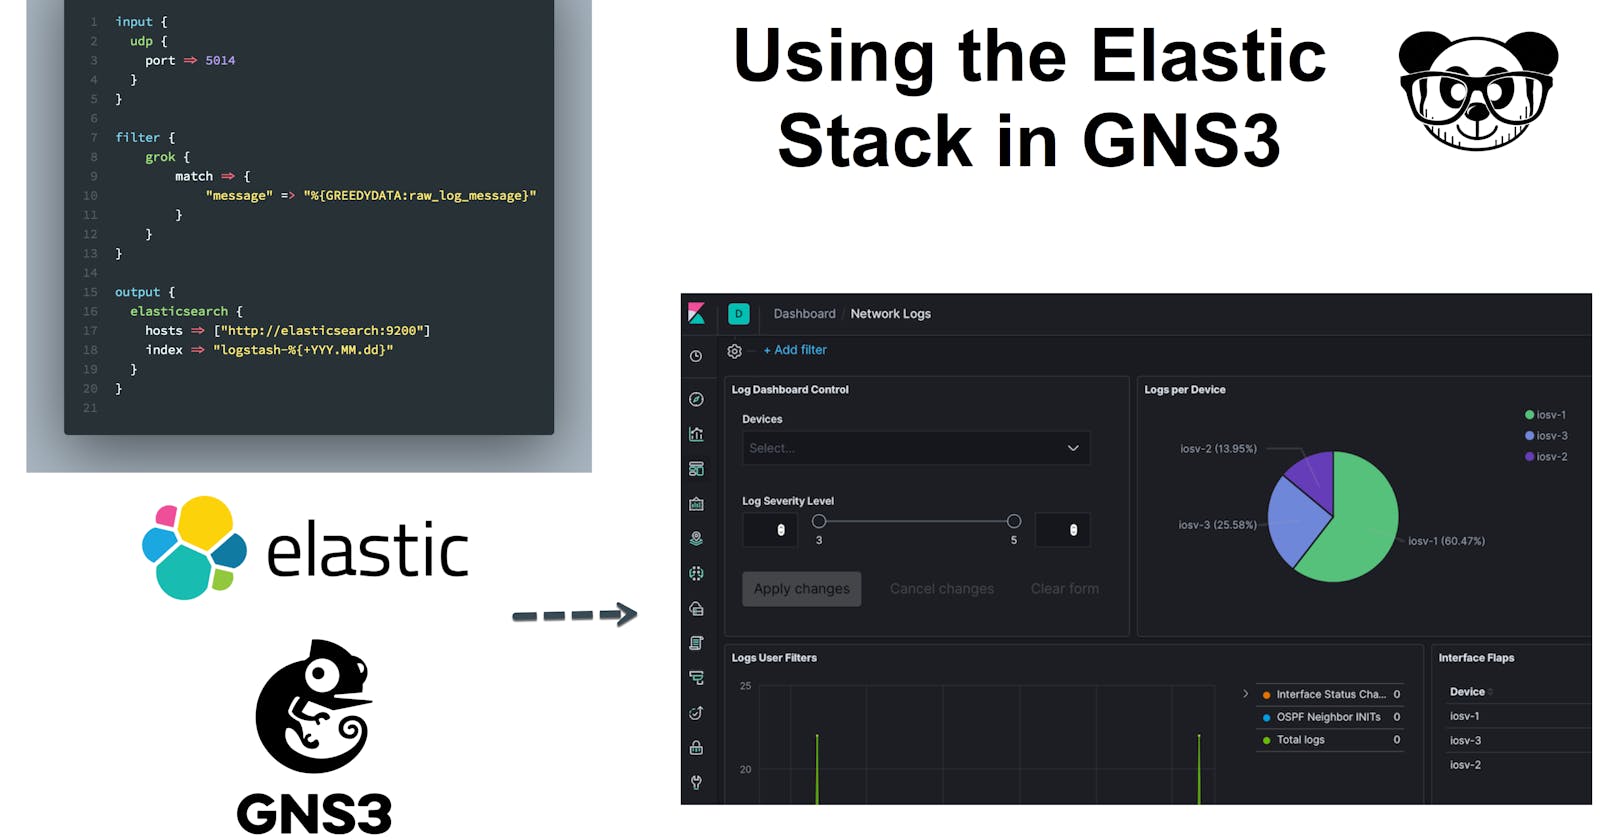
Here is an example pipeline that sends raw log event data to Elasticsearch:
input {
  udp {
    port => 5014
    type => syslog
  }
}

output {
  elasticsearch {
    hosts => [“http://elasticsearch:9200”]
    index => “netlogstash-%{+YYY.MM.dd}”
  }
}
input: Listens for the UDP syslog data on the standard 5014 port, we take the opportunity to also tag the data stream information.output: Sends the event data to Elasticsearch server to an index named based on the current date.
Elasticsearch
Elasticsearch is considered the heart of the Elastic Stack. It is a distributed, RESTful search and analytics engine that stores data. You can see here for a full list of features -> Elasticsearch features list | Elastic
Elasticsearch stores complex data structures that have been serialized as JSON documents. When you have multiple Elasticsearch nodes in a cluster, stored documents are distributed across the cluster and can be accessed immediately from any node.
When a document is stored, it is indexed and fully searchable in near real-time. An index can be thought of as an optimised collection of documents and each document is a collection of fields, which are the key-value pairs that contain the data.
Logstash will be injecting the log data as JSON documents under the index pattern netlogstash-%{+YYY.MM.dd}, which then can be searched and analysed.
Kibana
Kibana lets you visualize the Elasticsearch data with interactive visualizations and a powerful search mechanism.
As a starting point we need to tell Kibana which indices to look for the parsed log data, for this we need to create an index pattern netlogstash-*, which looks for the Logstash-generated indices no matter the time range.
Lab Architecture
The topology we will be testing have 2 networks connected between each other, different type of devices will be used in each. The features and protocols present are:
- OSPF
- BGP
- SYSLOG
- Basic AAA
- L3 interfaces
The network devices have their syslog configuration pointing towards a Logstash instance.
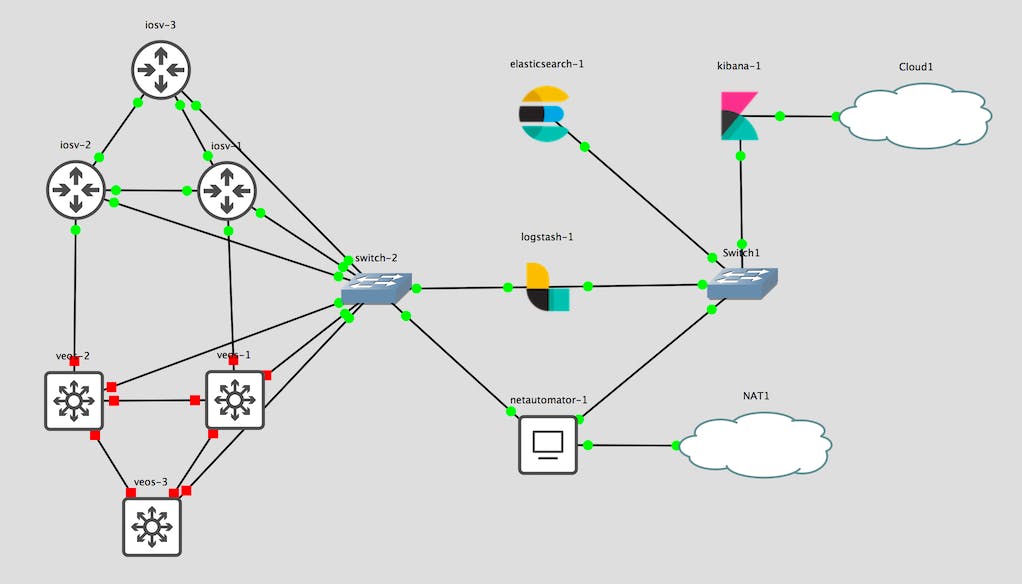
Images used
- Cisco IOSv L3
- Arista EOS 4.21F
Configuration and setup
I am simulating the entire environment on GNS3, with the help of docker and routers virtual images. The setup of the lab is out of scope for this post, but I suggest you read these articles.
- Automate your network labs with Ansible and GNS3 (Part 1)
- Automate your network labs with Ansible and GNS3: Part 2
The repository and Ansible project used to generate this lab can be found here in demo_elk
Putting all together
All the steps of the configuration, setup and testing can found in the following video. You can see how the Logstash pipelines work and are visualized on Kibana.
It is a lengthy video, similar to a webinar, so here is a brief overview of the topics you will find:
- Topology and routers configuration: 01:32
- Elastic Stack containers configuration: 03:43
- Verify Elastic Stack services: 09:50
- Start the lab with an initial logstash pipeline configuration: 14:01
- Checking initial syslog events in Kibana: 18:57
- Apply a grok filter in Logstash: 21:50
- [Visualisation] Network log view in Kibana: 28:20
- Apply a more advanced logstash configuration pipeline: 30:10
- [Visualisation] Network config audit view: 34:15
- [Visualisation] Horizontal bar chart of logs based on severity: 36:13
- [Visualisation] Pie chart of log count per device: 38:47
- [Visualisation] TSVB visualisation of log entries vs interface changes vs OSPF changes: 41:43
- [Visualisation] Data Table for interfaces flaps per device: 46:15
- [Visualisation] Dashboard Control: 49:21
- [Visualisation] Network Logs Dashboard: 51:18
Final thoughts
If you managed to see the entire video kudos! :). The ELK stack is powerful but can be difficult to get started for a Network engineer, hopefully with this post it makes it more approachable for getting hands on and quickly see the benefits of testing and implementing in your infrastructure.